|
||||||||||
|
|
||||||||||
|
||||||||||
|
|
||||||||||
|
|
|
|||||||||||||
|
Description:This experiment was conducted in the NASA Ames 9 by 7 ft supersonic wind tunnel on a generic supersonic high-sweep oblique wing model illustrated below.
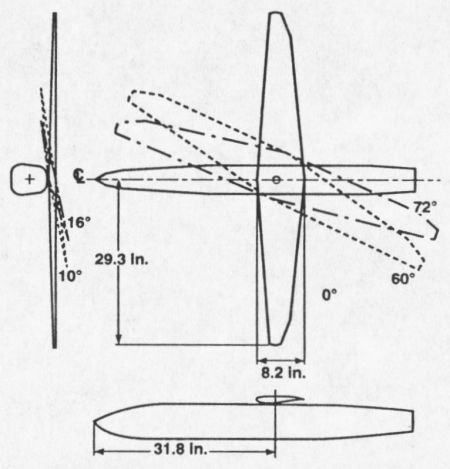
Scale diagram of oblique wing model [from McLachlan, 1995]The wing of the model utilized a supercritical airfoil section, and its sweep could be varied from 0° to 72°. A row of chordwise pressure taps was located at the quarter span point, and the bottom surface of the wing was coated with PSP. The illumination element was an array of seven short arc mercury vapor lamps, and the imaging element was a standard CCD video camera, with an 8-bit intensity resolution and a 512 X 480 pixel spatial resolution. The calibration for this experiment was carried out by using both the a priori and in situ methods.
Results:A representative example of the collected data is provided in the following image.
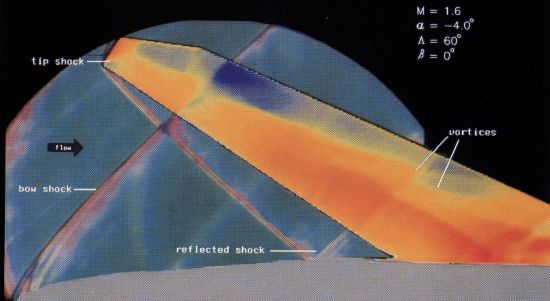
Surface pressure field overlaid with a schlieren image
|


|
Aircraft | Design | Ask Us | Shop | Search |
|
|
| About Us | Contact Us | Copyright © 1997- | |||
|
|
|||