|
|
Description:
This experiment was conducted on the generic transport wing/body configuration pictured below.
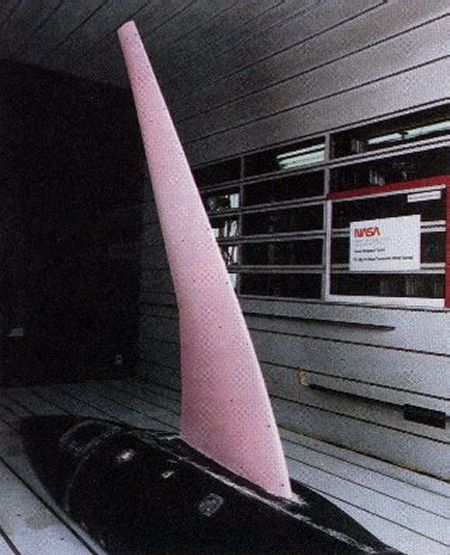
Generic transport wing/body model [from McLachlan and Bell, 1995]
The test was conducted in the NASA Ames Transonic Wind Tunnel at Mach numbers from 0.7 to 0.9. The model had a
wing semi span of 8 ft (2.4 m), and it was instrumented with several rows of pressure taps to provide comparison
between the two methods. The illumination elements were arrays of filtered arc lamps, while the imaging elements
were two scientific grade digital CCD cameras with 14-bit intensity resolution and 1024 X 1024 pixel spatial
resolution. The PSP was calibrated using the in situ method, since the model was already outfitted with pressure
taps.
Results:
A presentation of the PSP method's accuracy in this test is provided below, where the pressures obtained from the
PSP are compared to that obtained from pressure taps at a specific spanwise location. As can be seen, the
correlation between the taps and the PSP is quite good.
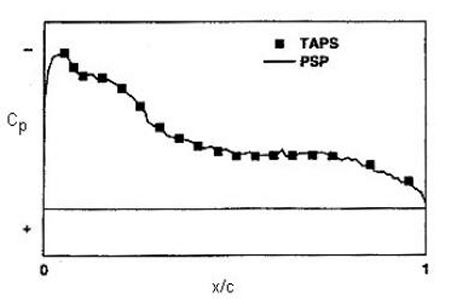
Comparison of data from PSP and pressure taps,
Taken at specific spanwise location, M=0.8 and alpha=10°
[from McLachlan and Bell, 1995]
An example of the wind-on and wind-off comparison is shown below. Blue denotes high intensity, while red
indicates low intensity.

Luminescence intensity for wind-on and wind-off conditions, M=0.8 and alpha=10°
[from McLachlan and Bell, 1995]
It is important to note the spatial variation of the intensity on the wind-off condition. This is due to
non-uniformities of the excitation illumination and thickness of the PSP coating. These non-uniformities are also
present in the wind-on image, although they are not readily apparent. Regardless, these non-uniformities
automatically factor out when the ratio of the images is calculated to determine the surface pressures.
The following figure shows pressure maps for the generic wing at a fixed Mach number for varying angles of attack.
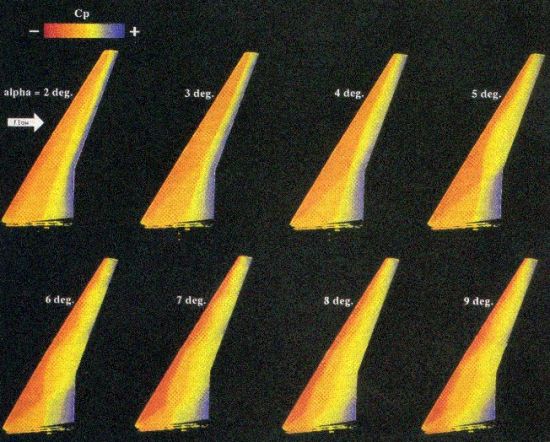
Pressure maps showing variation of pressure with varying angle of attack, M=0.8
blue denotes high pressure, red denotes low pressure
[from McLachlan and Bell, 1995]
This figure clearly demonstrates that PSP provides much more information on surface pressures than conventional
taps. Also demonstrated in this figure is the value of the PSP method as a flow visualization tool. The
variations in pressure over the varying angles of attack are easily seen, as are the intricate shock structures.
|