|
||||||||||
|
|
||||||||||
|
||||||||||
|
|
||||||||||
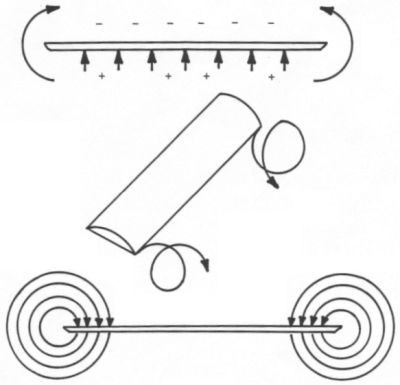
However, another basic theory does provide a reasonable, first-order approximation for the drag coefficient. This technique is called Prandtl's Lifting Line Theory. Thin Airfoil Theory is derived assuming that a wing has an infinite span, but lifting line theory applies to a finite wing with no sweep and a reasonably large aspect ratio. In simple terms, the wing is modeled as a fixed vortex with a series of trailing vortices extending behind it. These trailing vortices have the effect of reducing the lift produced by the wing and creating a form of drag called induced drag.
According to Lifting Line Theory, the lift coefficient can be calculated in the following way:
where
For example, the value 2π is used in the following graphs comparing experimental lift coefficients for two aircraft as measured in a wind tunnel against predictions from both Thin Airfoil Theory and Lifting Line Theory. The first comparison shows the Cessna 172 with its relatively high aspect ratio of 7.37. Note that the Lifting Line prediction is only a slight improvement over Thin Airfoil Theory when compared to the Cessna wind tunnel data, though the slope of the Lifting Line equation does better match that of the actual data. Also note that like Thin Airfoil Theory, the Lifting Line model is not capable of predicting stall and only provides a good estimate of the lift up to the stall angle.

where
where
where
| Minimum Drag Coefficients | ||||
|---|---|---|---|---|
| Aircraft | Type | Aspect Ratio | CDmin | |
| RQ-2 Pioneer | Single piston-engine UAV | 9.39 | 0.0600 | |
| North American Navion | Single piston-engine general aviation | 6.20 | 0.0510 | |
| Cessna 172/182 | Single piston-engine general aviation | 7.40 | 0.0270 | |
| Cessna 310 | Twin piston-engine general aviation | 7.78 | 0.0270 | |
| Marchetti S-211 | Single jet-engine military trainer | 5.09 | 0.0205 | |
| Cessna T-37 | Twin jet-engine military trainer | 6.28 | 0.0200 | |
| Beech 99 | Twin turboprop commuter | 7.56 | 0.0270 | |
| Cessna 620 | Four piston-engine transport | 8.93 | 0.0322 | |
| Learjet 24 | Twin jet-engine business jet | 5.03 | 0.0216 | |
| Lockheed Jetstar | Four jet-engine business jet | 5.33 | 0.0126 | |
| F-104 Starfighter | Single jet-engine fighter | 2.45 | 0.0480 | |
| F-4 Phantom II | Twin jet-engine fighter | 2.83 |
0.0205 (subsonic) 0.0439 (supersonic) |
|
| Lightning | Twin jet-engine fighter | 2.52 | 0.0200 | |
| Convair 880 | Four jet-engine airliner | 7.20 | 0.0240 | |
| Douglas DC-8 | Four jet-engine airliner | 7.79 | 0.0188 | |
| Boeing 747 | Four jet-engine airliner | 6.98 | 0.0305 | |
| X-15 | Hypersonic research plane | 2.50 | 0.0950 | |
The efficiency factor, e, varies for different aircraft, but it doesn't change very much. As a general rule, high-wing planes tend to have an efficiency factor around 0.8 while that of low-wing planes is closer to 0.6. A reasonable average to use for most planes is about 0.75.
The equation we have derived is also sometimes expressed in the following form, where the factors in the denominator of the CL˛ term are combined into yet another new constant called K.
Assuming a typical value for aspect ratio of around 6 and an efficiency factor of 0.75, the value of K turns out to be about 0.07.
We now have equations to estimate the lift as a function of angle of attack and equations to estimate drag as a function of lift. It is simple to combine the two to produce an equation for drag as a function of angle of attack. Regardless of whether we use the Thin Airfoil approximation for the lift coefficient or the Lifting Line method, we get an equation of the form:
When graphed as a function of angle of attack, the drag coefficient tends to look like a parabola. It therefore makes sense that drag increases with the square of angle of attack in the above equation.
Related Topics:
Read More Articles:


|
Aircraft | Design | Ask Us | Shop | Search |
|
|
| About Us | Contact Us | Copyright © 1997- | |||
|
|
|||