|
||||||||||
|
|
||||||||||
|
||||||||||
|
|
||||||||||
The detection method related to your question is by means of radar. Radar is a system that allows the location, speed, and/or direction of a vehicle to by tracked. The word "radar" is actually an acronym standing for RAdio Detection And Ranging since the device uses radio waves to detect targets. Radar works by sending out pulses of these electromagnetic waves and then "listening" for echoes bounced back by targets of interest.
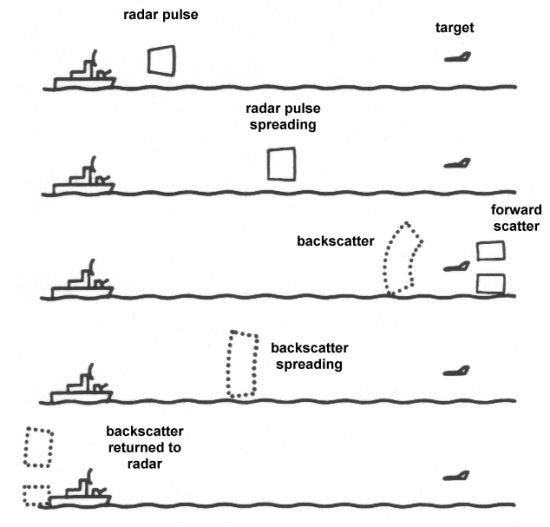
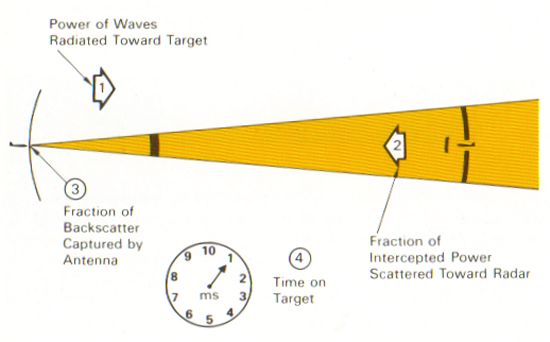
Even though a radar may transmit megawatts of power in a single pulse, only a tiny fraction of that energy is typically bounced back to be received by the radar antenna. The amount of power returned from a target to the transmitting radar depends on four major factors:
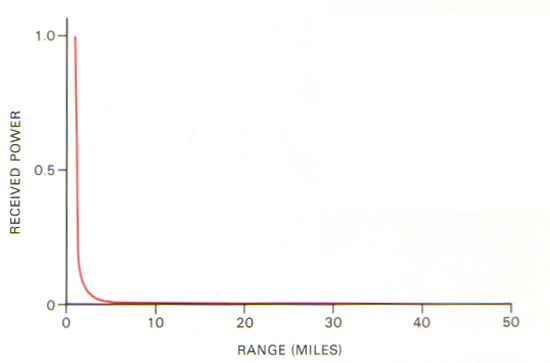
A term used to describe the relationship between these variables is power density, sometimes also called power flux. To understand power density, consider the following diagram. The power transmitted by a radar is dissipated the further it travels because it is spread over an increasingly larger area. The area over which the power is spread is proportional to the square of the distance, or range (R), from the transmitting radar. The amount of power spread over a given area is called the power density, and this quantity decreases by the square of the range. The power density of the transmitted radar wave at the range of the target has a special name called the incident power density (Pincident).
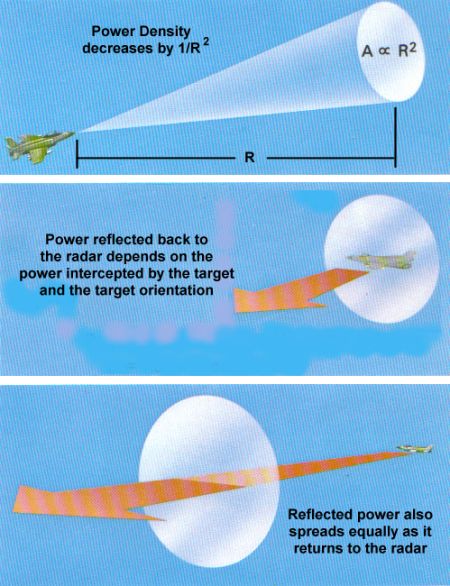
Once the radar power reaches the target, some portion of that power will be reflected back to its source. However, this reflected power also dissipates and spreads out as it echoes back to the radar receiver. Since the power density has already been reduced by a factor of 1/R˛ by the time it reaches the target and is again reduced by 1/R˛ on the return trip, the final power density of the energy received by the radar is proportional to 1/R4. The ability of a radar to detect the target depends on whether the amount of power returned is large enough to be differentiated from internal noise, ground clutter, background radiation, and other sources of interference. The goal of stealth techniques is to bounce so little radar power back to its source that the target is nearly impossible to detect or track.
The amount of power that is reflected back to the radar depends largely on a quantity called the radar cross section (RCS.) Although RCS is technically an area and typically expressed in square meters (m˛), it is helpful to break the term apart to better understand what it means. Radar cross section is usually represented by the Greek letter σ (pronounced "sigma"), and the quantity depends on three factors.
We have mentioned that the power reflected by the target can be much stronger in some directions than in others. As a result, that reflected power will be much greater or much smaller than the isotropic power depending on how the target is oriented to the transmitting radar. The directivity, therefore, will be much greater than 1 when the target returns a strong backscatter in the direction of the radar and much less than 1 when the backscatter is small.
Simplifying that expression yields the following relationship for radar cross section.
The importance of radar cross section can best be understood by looking at an equation relating the RCS of the target to the energy received by the radar.
where
Furthermore, every radar has a minimum signal energy that it can detect, a quantity we will call Smin. This minimum signal energy determines the maximum range (Rmax) at which a given radar can detect a given target.
According to this relationship, reducing the radar cross section of a vehicle to 1/10th of its original value will reduce the maximum range at which the target can be detected by nearly 44%! While that reduction alone is significant, even greater reductions in RCS are possible.
At this point, you may be wondering what terms like gain and aperture mean, but we will address those in a future article that discusses the principles of radar in greater detail. For now, let us return to radar cross section and describe how it is measured.
The greatest challenge aircraft designers have traditionally faced in creating a vehicle difficult to detect by radar is the ability to predict what the RCS will be for a complicated shape from any given direction. That difficulty was only overcome in recent decades when computers became powerful enough to solve a series of equations describing how radar waves scatter off complicated shapes. These equations are based on Maxwell's equations developed by James Clerk Maxwell in the mid-1800s. Maxwell's equations describe the behavior of electric and magnetic fields and are at the heart of a branch of physics called electrodynamics. While the four equations Maxwell derived are relatively simple, they can become quite complex when trying to predict the electromagnetic properties of shapes reflecting radar energy.
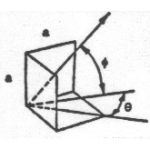
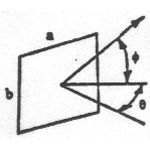
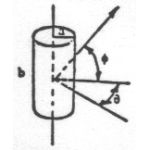
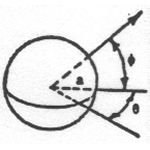
Results derived from Maxwell's equations can be seen in the following table. Presented here are equations that predict the RCS of simple shapes like spheres, cylinders, and flat plates, and shapes are ordered based on the relative strength of the maximum RCS. The strength of the radar return is also a function of the angle at which the radar waves impact against the surface, or the incident angle. This angle is a function of two angles called the aspect (θ) and azimuth (φ) angles. The variable λ represents the wavelength of the radar beam, which is assumed to be smaller than the dimensions of the shape.
| Geometry | Description | Maximum RCS | Comments |
|---|---|---|---|
|
Square trihedral corner reflector |

|
Strongest radar return due to triple reflection of incident wave |
|
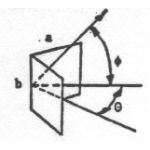
Right dihedral corner reflector |
|
Second strongest radar return due to double reflection of incident wave; decreases from maximum slowly with changing θ and rapidly with changing φ |
|
Flat plate |
|
Third strongest radar return due to direct reflection of incident wave; decreases rapidly as incidence angle changes from perpendicular |
|
Right circular cylinder |
|
Strong radar return as aspect (θ) changes, but decreases rapidly as azimuth (φ) changes |
|
Sphere |
|
Produces the same isotropic return in all directions |
As indicated throughout the above table, the radar cross section varies depending on the angle of incidence between the surface of the shape and the transmitted radar beam. The graph below gives some idea of just how much the RCS of a cylinder changes with the aspect angle. The data is expressed in dBsm, or decibels referenced to one square meter. Radar cross section in square meters can be converted to dBsm by the following equation.
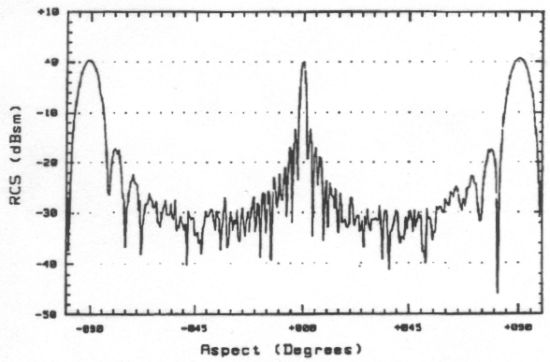
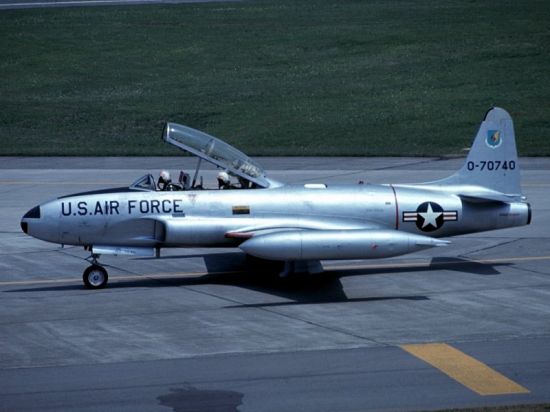
Data of this form is also routinely collected for more complex shapes, like complete aircraft. An example is shown below for the elderly T-33 trainer. The radar cross section data is provided at all aspects at an azimuth of 0°.
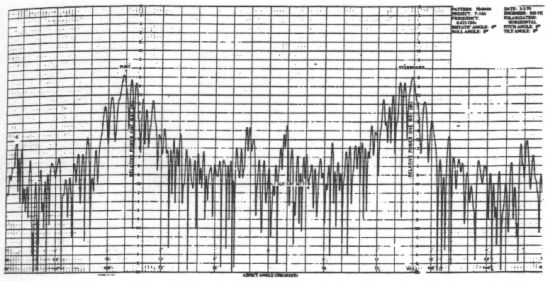
Since data collected in this form is somewhat difficult to read and interpret, it is common to present RCS measurements in the form plotted below. This type of graph is called a polar plot, and it is used to chart the median RCS data over a range of aspect angles. In this case, the T-33 results have been plotted at 10° increments.
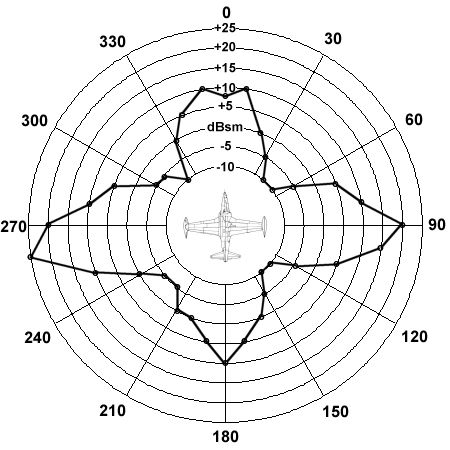
These medianized plots allow us to better see the trends in RCS behavior around the aircraft. The largest radar returns can be seen from the sides of the plane, where the large vertical tail and wingtip fuel tanks produce strong reflections. Both the forward and aft aspects also produce relatively large peaks in RCS that are probably due to reflections off the blades of the jet engines. The smallest RCS measurements tend to come from the corners of the aspect envelope where there are no surfaces perpendicular to the radar source and the engines are shielded from view. While the magnitudes of RCS values for other planes will vary significantly from those shown for the T-33, the trends illustrated here are probably representative of most other aircraft.
In general, however, the most important RCS measurement is considered to be the head-on view. RCS values provided for aircraft and other flying vehicles are almost always based on this orientation. Nevertheless, it can be difficult to directly compare RCS estimates from one plane to another since the RCS varies wildly depending on aspect, radar frequency and wavelength, and the fidelity of the receiver.
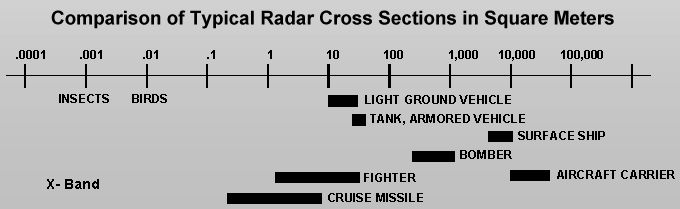
The above figure illustrates typical RCS values for aircraft and other objects, ranging from insects and birds up
to large ground vehicles and ships. The RCS of a stealth aircraft is typically multiple orders of magnitude lower
than a conventional plane and is often comparable to that of a small bird or large insect.
- answer by Jeff Scott, 21 March 2004
Read More Articles:


|
Aircraft | Design | Ask Us | Shop | Search |
|
|
| About Us | Contact Us | Copyright © 1997- | |||
|
|
|||